AP C. 1 is identifying the properties of the Normal distribution.

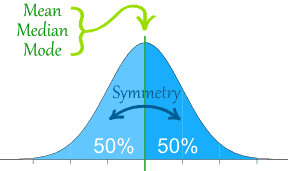
A data can be distributed or spread out in different ways, but a normal distribution is when the shape of the distribution is bell-shape. The normal distribution has a mean, median, and mode that is located in the middle of the x-axis. It has a symmetry about the center which is 50% of the distribution is less than the mean and 50% is more than the mean. For a standard normal distribution, the distribution
has been standardized using z-score. The standardized z-scores will have the same shape of the original distribution. A normal model, N(μ,σ), with mean μ = 0 and standard deviation σ = 1. The area under the normal curve or distribution will always equal one. The points of inflection will be one standard deviation from the mean. The distribution has to have a curve that is asymptotic to the x-axis. In example:The mean and standard deviation of a normally distributed dataset are 20 and 5. 20 is added from every term in the dataset and then the result is divided by 4. The distribution will have a mean of 0, a standard deviation of 1 and since it is a normal distribution, it has a normal curve.
Brendan Bettinger's Cinemath article talked about the linear regression model based on the five variables which includes: RT (The Rotten Tomatoes), Budget, Number of Theatres, if there is going to be a sequel, and whether it is a PG-13 or not. When Bettinger tested his linear regression model, the 2010 and 2011 both have a near coefficient of determination of 61%. The graph shows that it is a positive association between the Rotten Tomatoes and the Domestic Box Office. In conclusion, the linear regression model have a good estimating gross.

I like the article because it talked about many factors of film and how other variables come to play. I thought it was interesting how Brendan Bettinger thought about predicting the box office gross using statistics. I like how this relates to what we are learning right now and how this help my understanding of this unit better. I like how Bettinger described some movies does not work with the equation and yet he is still trying to find out but for some movies such as Mission Impossible: Ghost Protocol and Rise of the Planet of the Apes. To put the equation to test, I am going to select a random movie in 2011 like Thor. Here is the equation: Gross = –80 + 0.6×RT + 0.5×Budget + 0.025×Theaters + 50×Sequel + 20×PG13.
In the Cinemath article, Bettinger showed us his theory of the box office gross by using the 2011 scatterplot. In AP Statistics, we are learning the making of scatter plots and to form its best fit "line" creating what is called the linear regression model. There was also a mentioned of coefficient of determination which was R2 in the article.
In statistic class, we have only used two variables for the linear regression equation. We have touched on the R2 in class but have not gone deep into. We learned to what it is but not what it does.
Due to the calculation, I got $65.72 million but I could have made an error. I was not sure what to do with the sequeal and the PG13 because I did not know what to input and made it a one. In ending, the actual Domestic Total gross were $181 million. I want to predict the gross of the next movie that is going to come out using the equation. The movie Pusher that is going to come out on October the 26th, 2012 and the estimate gross is $215.5 million. The budget for the movie was low but the predicted gross is high so we will see...
ED E.5 Frequency and Relative Frequency Tables

Frequency and relative frequency tables are categorical data. The difference between the frequency and relative relative frequency is that for relative, you use percentages rather than numbers. The contingency table above is a table that I created for standard ED E.5. The distribution is a data that I created, not collected. This standard make sure that I can identify the correct values that make up the marginal, joint, and conditional frequencies given a two way table. The following contingency table shows how many students at Mason High School play for each sport in the different class. From the categorical data, the marginal distribution for the sports would be: Golf = 15/195, 7.69% ; Lacrosse = 22/195, 11.28% ; Swimming = 24/195, 12.31% ; Water Polo = 26/195, 13.33% ; Soccer = 33/195, 16.92% ; Basketball = 33/195, 16.92% ; Football = 42/195, 21.54%. The marginal distribution for the high school class would be: Freshman = 51/195, 26.15% ; Sophomore = 46/195, 23.59% ; Junior = 55/195, 28.21% ; Senior = 43/195, 22.05%. The marginal distribution focuses on the total of 1 variable. The conditional distribution, however, we are looking at 1 limiting factor. For example: In Mason High School, Freshman that play golf would be 3/17, 17.65%. Freshman that play Lacrosse = 5/22, 22.72%. Senior that play football would be 12/42, 28.57%.